Measuring Energy Use in LLM Inference
Before reading: This article uses the terms prefill, decode, and batching. If they are unfamiliar, start with NVIDIA’s introduction to LLM inference.
Power and energy are easy to confuse. Power is how quickly the GPU uses energy at one moment, measured in watts. Energy is the total amount used over time, measured in joules. When running a model, one quantization format or inference engine can make the GPU draw fewer watts but take longer to generate the same tokens. Because energy depends on both power and running time, the lower-power option can still use more energy for each token.
An active GPU also draws power while it is doing no useful work. We call this the idle floor. Whether we charge that idle power to a request changes how we interpret the same measurement. The question was: how do engine choice, quantization, batching, and the idle floor change the energy cost of each generated token?
Why this matters
Tokens per second tells us how fast a system is, but not how much energy it uses to produce each token. The electricity and cooling required for inference affect both operating cost and environmental impact. A faster configuration is not necessarily more sustainable if it uses much more energy for each useful token. A lower-power configuration is not necessarily better either if it runs for much longer. Datacenters need this distinction when choosing hardware and sizing serving systems. Local AI systems need it when battery life, heat, and electricity use matter.
What we did
I measured Qwen2.5-1.5B inference on one SM86 RTX 3060 12 GB GPU. At batch 1, I compared Hugging Face FP16, Hugging Face NF4, and vLLM FP16. I then tested vLLM at batches from 1 to 128.
During decode, the GPU repeatedly transfers model weights from its memory and uses them to generate the next token. Transferring more data generally requires more energy, so quantization can reduce power by reducing the number of bytes moved. However, total energy also depends on how long the kernel takes to finish. This is why I measured both power and execution time instead of assuming that fewer transferred bytes meant lower energy per token.
The primary instrument was NVIDIA’s total-energy counter. It records how many millijoules the GPU has consumed, so the difference between the start and end readings gives the energy used by a run. I also sampled board power every 20 ms as a cross-check. On the real 5 to 16 second measurement windows, the two methods agreed within 0.5% on 20 of 22 rows.
The model-resident idle floor remained between 37.7 W and 39.3 W after the GPU clocks had time to settle.
FP16 versus NF4: lower power did not mean lower gross energy
NF4 moved fewer weight bytes, which reduced board power. However, this bitsandbytes path generated tokens much more slowly. As a result, the 38 W idle floor continued for more time while each token was generated.
| batch-1 measurement | FP16 | NF4 | NF4 result |
|---|---|---|---|
| throughput | 59.5 tok/s | 26.8 tok/s | 2.2 times slower |
| board power | 116.2 W | 63.6 W | 45% lower |
| gross energy per token | 1,960 mJ | 2,374 mJ | 1.21 times worse |
| energy net of idle | 1,337 mJ | 905 mJ | 1.48 times better |
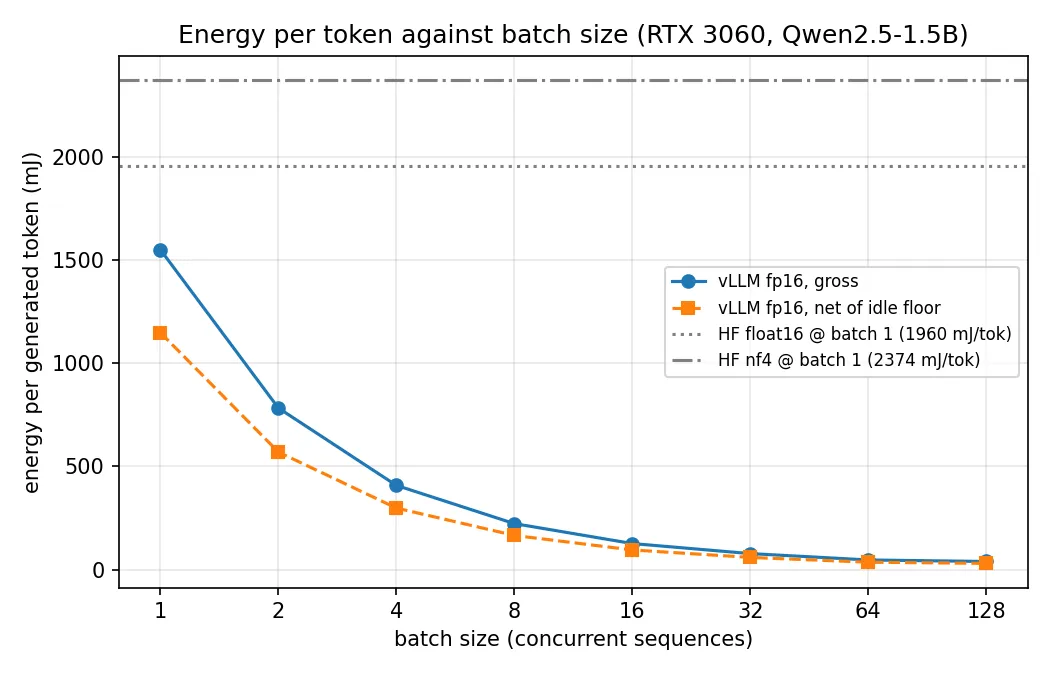
Gross energy includes all GPU board energy recorded during the run. Net energy subtracts the measured model-resident idle floor over the same interval.
Gross versus net energy, in simple terms
Use gross energy when the GPU is running specifically to complete a job and may be turned off afterward. Gross energy includes everything the GPU used while the job was running. A complete calculation would also include the energy needed to start and stop the GPU, which this experiment did not measure.
Use net energy when the GPU will remain powered on anyway. Net energy subtracts the energy that the idle GPU would have consumed during the same time. It therefore estimates the additional energy used to run inference.
This is why the NF4 result changes between the two measurements. NF4 took longer, so it used 1.21 times more gross energy per token. After subtracting the energy the GPU would have used while idle, NF4 used 1.48 times less net energy per token because its active power was lower.
vLLM at batch 1: more speed also required more power
vLLM was 1.6 times faster than Hugging Face FP16 at batch 1, but it also kept the GPU busier. Its board power was 149.0 W instead of 116.2 W. This reduced gross energy per token by 1.26 times, which was useful but smaller than the speed improvement.
| batch-1 engine | throughput | board power | gross energy per token |
|---|---|---|---|
| Hugging Face FP16 | 59.5 tok/s | 116.2 W | 1,960 mJ |
| vLLM FP16 | 96.0 tok/s | 149.0 W | 1,552 mJ |
Batching: the largest energy improvement
A decode step reads the same weights whether it advances one sequence or many. With batching, many sequences share each weight read.
| batch | throughput | board power | gross energy per token |
|---|---|---|---|
| 1 | 96.0 tok/s | 149.0 W | 1,552 mJ |
| 8 | 672.9 tok/s | 150.1 W | 223 mJ |
| 32 | 2,079.8 tok/s | 161.1 W | 78 mJ |
| 128 | 4,136.6 tok/s | 162.1 W | 39 mJ |
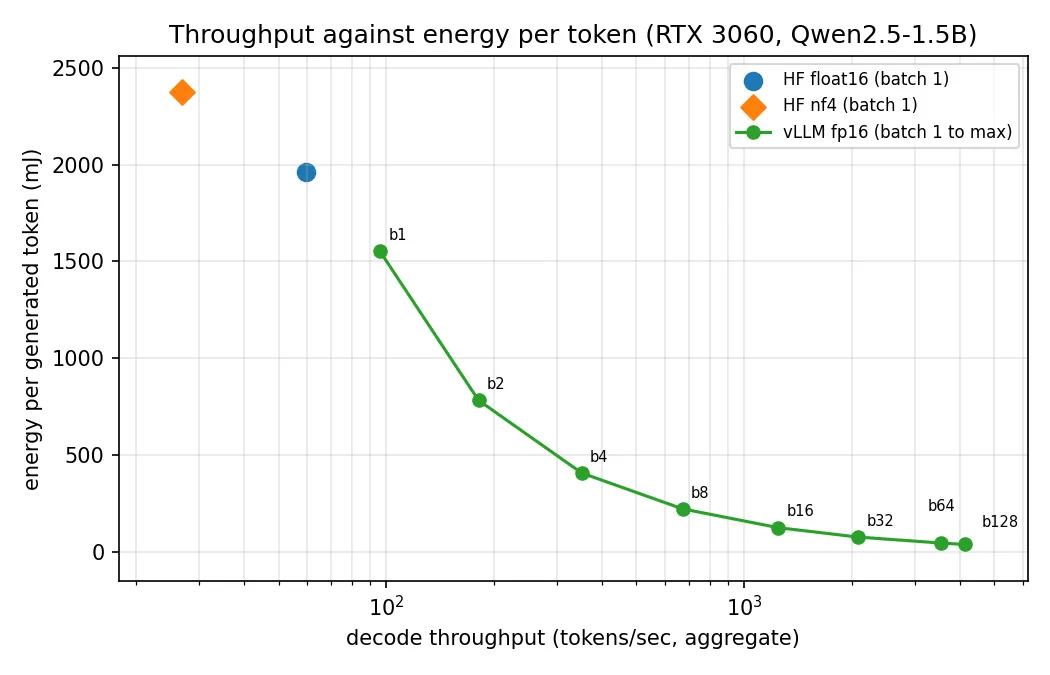
Batching changed both throughput and energy efficiency much more than the choice between FP16 and NF4.
Board power stayed within 142 to 166 W across the complete sweep while throughput increased by about 43 times. Energy per token therefore fell by 40 times. The curve began to flatten from batch 64 to 128 as the GPU approached its compute limit.
Conclusion
Lower power did not guarantee lower energy per token. NF4 ran cooler, but its slower batch-1 execution consumed more gross energy. It used less incremental energy only after subtracting the idle floor. Batching produced the clearest improvement because it spread nearly fixed GPU work across many more tokens.
These results apply to one GPU, one model, and the measured software versions. NVML measured the complete GPU board, not separate memory and compute energy. CPU and whole-server energy were outside the experiment.
GitHub repository
The complete report, raw measurements, benchmark code, and reproduction instructions are available in the LLM Inference Optimization repository.